Change scalePrior
baredSC_2d uses as a prior on the correlation value of each Gaussian a normal distribution. In order to reduce the number of false-positive (anti-)correlation detection. The scale of the normal distribution is set to 0.3. We show here the influence of this prior. The input table can be downloaded from here.
Inputs
We took total UMI counts from a real dataset of NIH3T3. We generated a example where the PDF of the 2 genes is a 2D Gaussian. The mean on each axis and the scale on each axis is equal to 0.5 and the correlation value is also 0.5.
Run baredSC in 2D
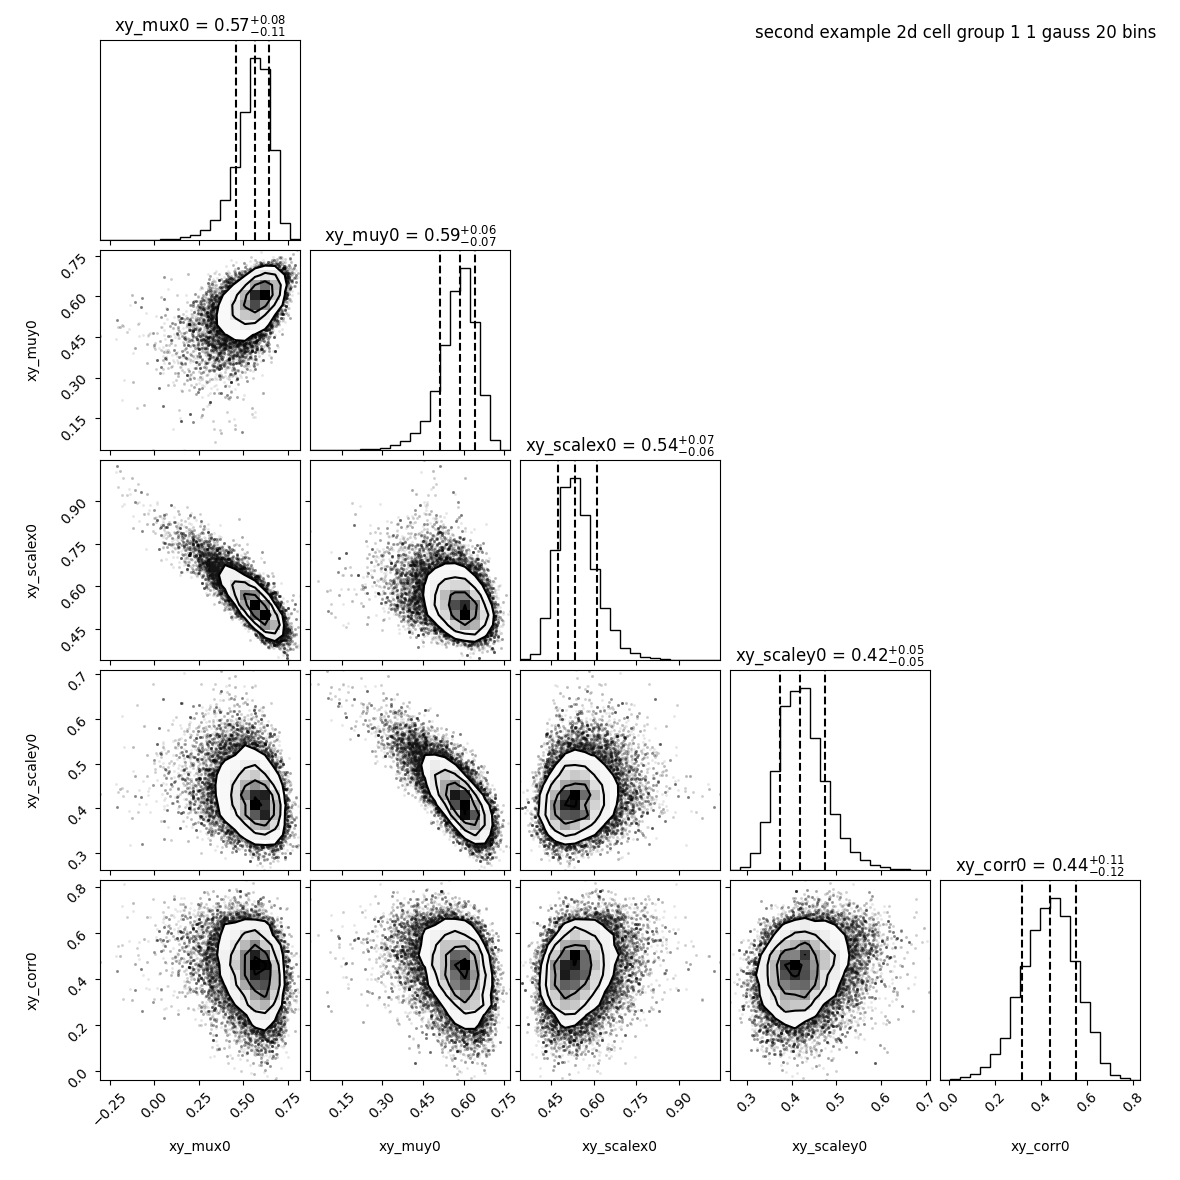
By default baredSC_2d uses 50 bins in x and 50 bins in y. But to increase the speed we use only 20 bins:
$ nnorm=1
$ baredSC_2d \
    --input example/nih3t3_generated_second.txt \
    --geneXColName 1_0.5_0.5_0.5_0.5_0.5_x \
    --geneYColName 1_0.5_0.5_0.5_0.5_0.5_y \
    --metadata1ColName group \
    --metadata1Values group1 \
    --output example/second_example_2d_cellgroup1_${nnorm}gauss_nx20 \
    --nnorm ${nnorm} \
    --nx 20 --ny 20 \
    --figure example/second_example_2d_cellgroup1_${nnorm}gauss_nx20.png \
    --title "second example 2d cell group 1 ${nnorm} gauss 20 bins"
We see that the correlation found is 0.44 +/- 0.11.
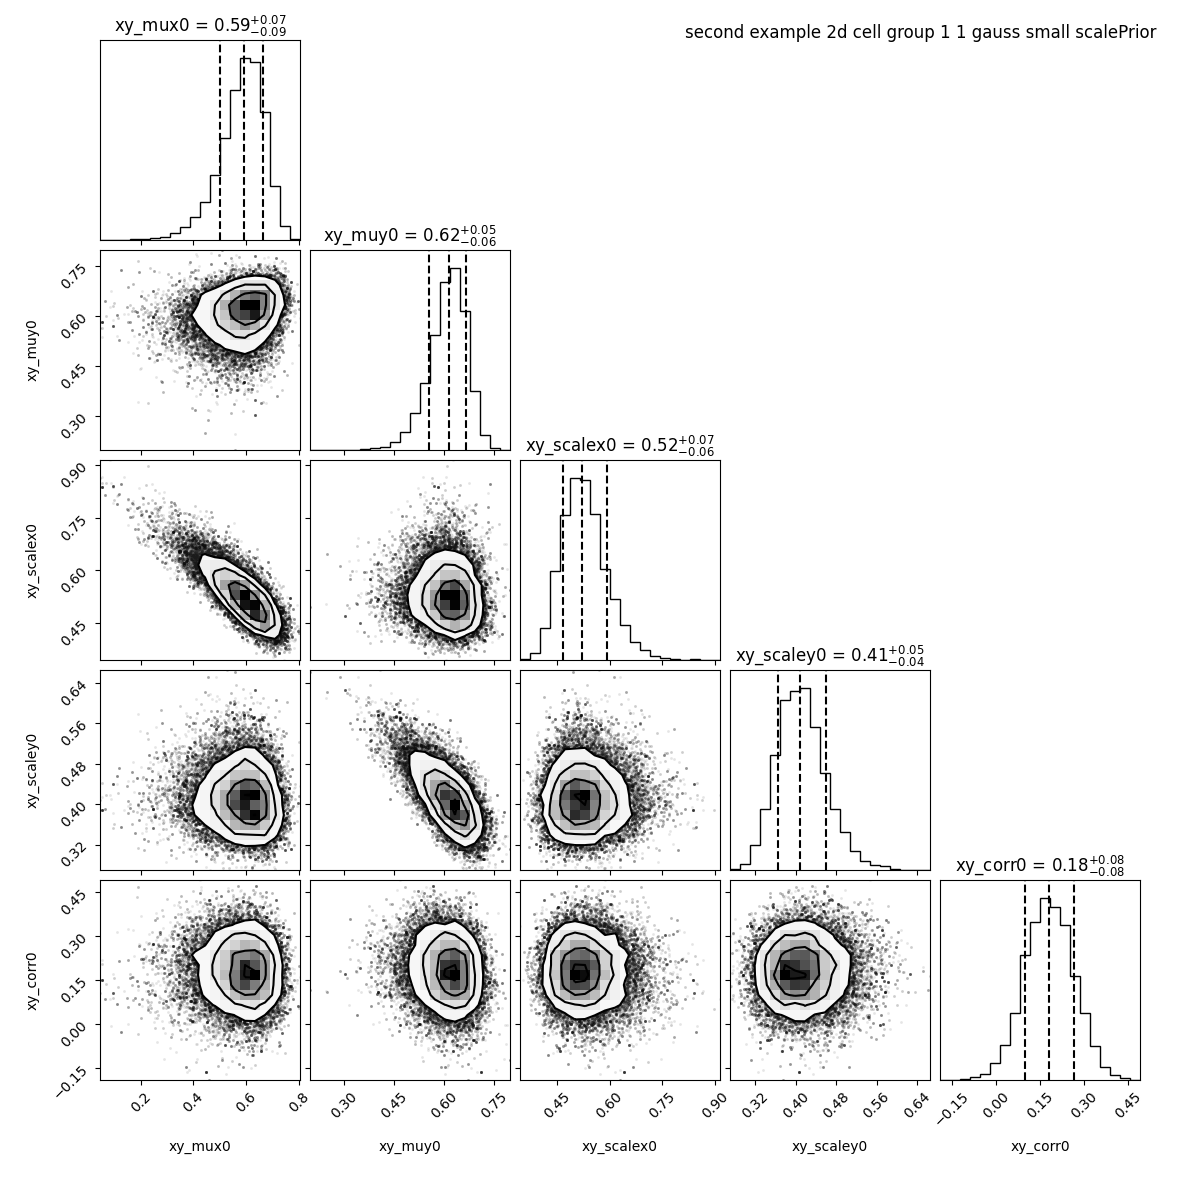
Let see how this changes if we reduce the scale of the Normal distribution of the prior to 0.1
$ nnorm=1
$ baredSC_2d \
    --input example/nih3t3_generated_second.txt \
    --geneXColName 1_0.5_0.5_0.5_0.5_0.5_x \
    --geneYColName 1_0.5_0.5_0.5_0.5_0.5_y \
    --metadata1ColName group \
    --metadata1Values group1 \
    --output example/second_example_2d_cellgroup1_${nnorm}gauss_nx20_smallSP \
    --nnorm ${nnorm} \
    --nx 20 --ny 20 \
    --scalePrior 0.1 \
    --figure example/second_example_2d_cellgroup1_${nnorm}gauss_nx20_smallSP.png \
    --title "second example 2d cell group 1 ${nnorm} gauss small scalePrior"
We see that the correlation drop to 0.18 +/- 0.08.
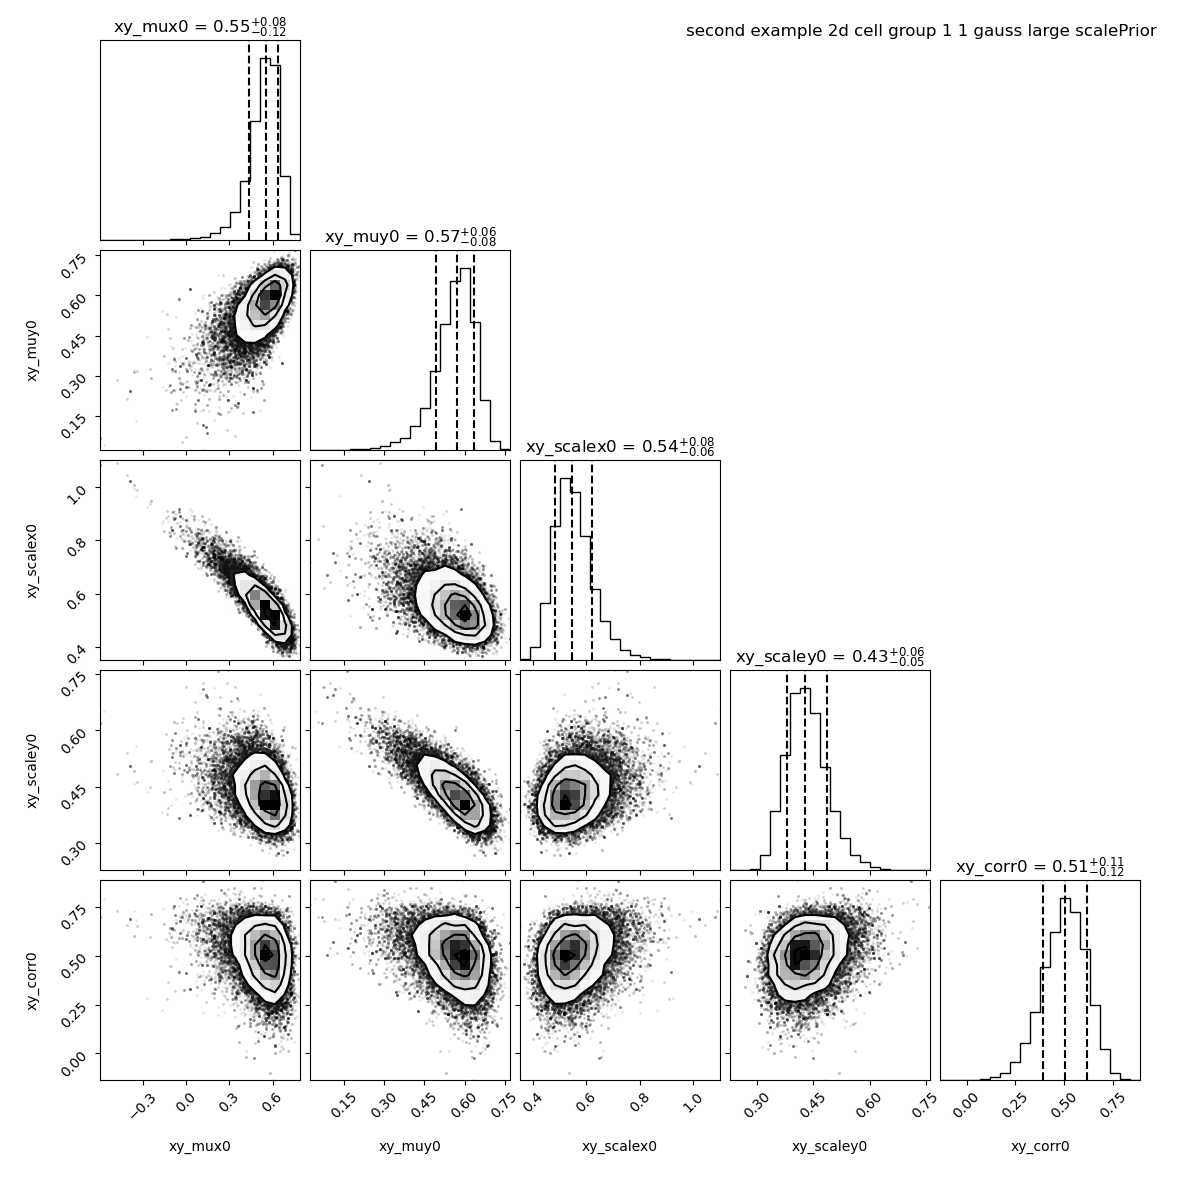
On the contrary, if we know that there is a correlation we can increase this value in order to remove the penalty on high correlation coefficient.
$ nnorm=1
$ baredSC_2d \
    --input example/nih3t3_generated_second.txt \
    --geneXColName 1_0.5_0.5_0.5_0.5_0.5_x \
    --geneYColName 1_0.5_0.5_0.5_0.5_0.5_y \
    --metadata1ColName group \
    --metadata1Values group1 \
    --output example/second_example_2d_cellgroup1_${nnorm}gauss_nx20_largeSP \
    --nnorm ${nnorm} \
    --nx 20 --ny 20 \
    --scalePrior 3 \
    --figure example/second_example_2d_cellgroup1_${nnorm}gauss_nx20_largeSP.png \
    --title "second example 2d cell group 1 ${nnorm} gauss large scalePrior"
We see that the correlation is now at 0.51 +/- 0.11.
However, these settings may detect (anti-)correlations in situation where there is no, that’s why we recommand the default value if you don’t have any knowledge on the correlation you expect.