Change scalePrior
baredSC_2d uses as a prior on the correlation value of each Gaussian a normal distribution. In order to reduce the number of false-positive (anti-)correlation detection. The scale of the normal distribution is set to 0.3. We show here the influence of this prior.
Inputs
We took total UMI counts from a real dataset of NIH3T3. We generated a example where the PDF of the 2 genes is a 2D Gaussian. The mean on each axis and the scale on each axis is equal to 0.5 and the correlation value is also 0.5.
Run baredSC in 2D
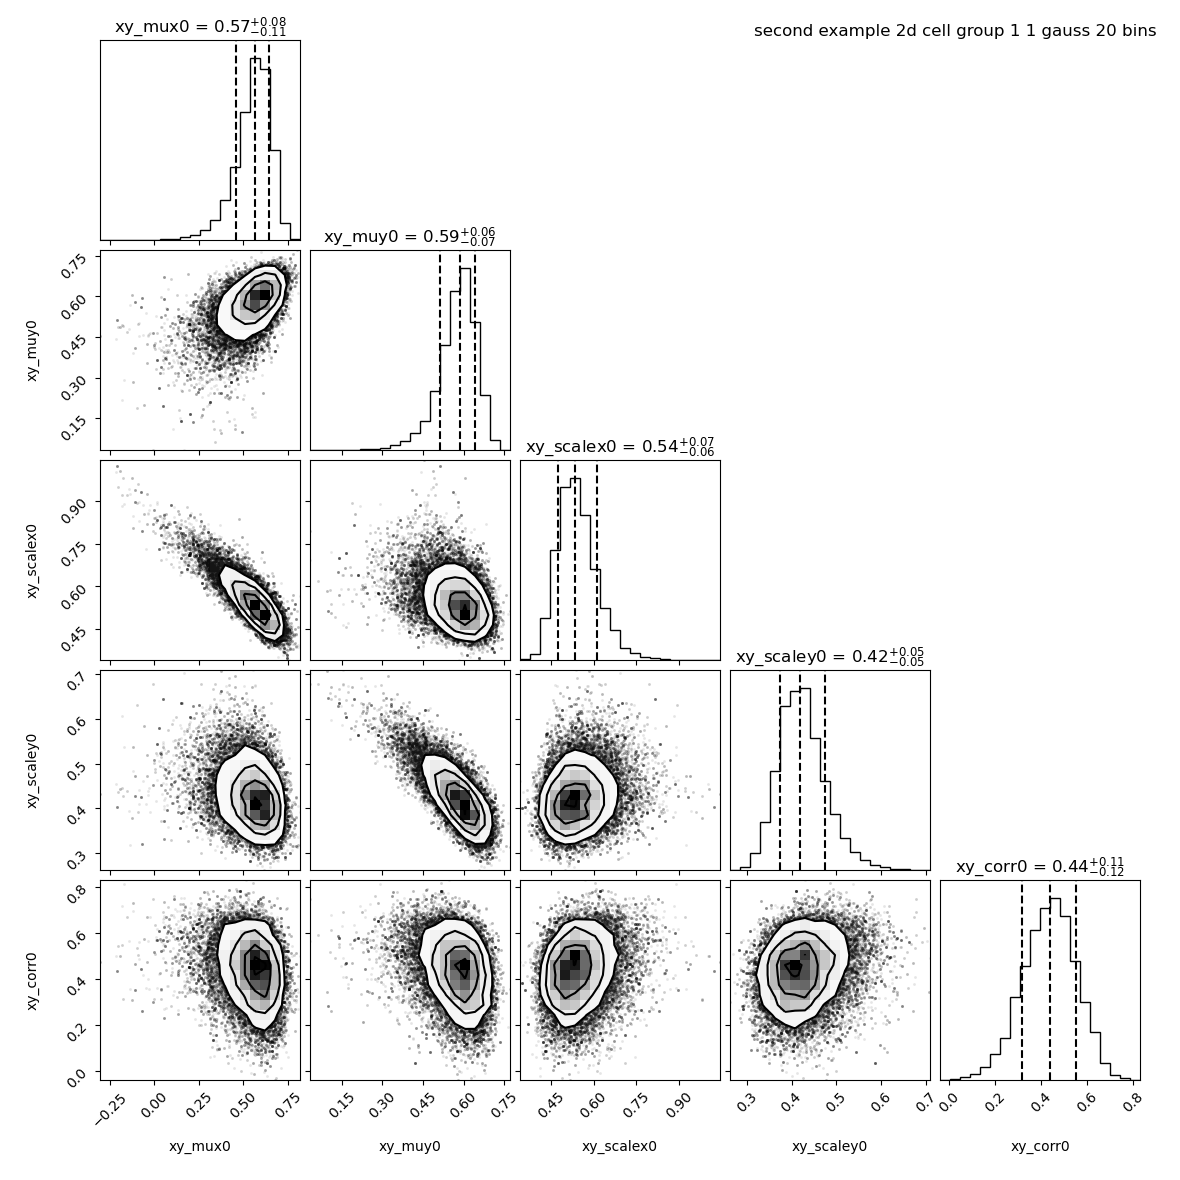
By default baredSC_2d uses 50 bins in x and 50 bins in y. But to increase the speed we use only 20 bins:
$ nnorm=1
$ baredSC_2d \
    --input example/nih3t3_generated_second.txt \
    --geneXColName 1_0.5_0.5_0.5_0.5_0.5_x \
    --geneYColName 1_0.5_0.5_0.5_0.5_0.5_y \
    --metadata1ColName group \
    --metadata1Values group1 \
    --output example/second_example_2d_cellgroup1_${nnorm}gauss_nx20 \
    --nnorm ${nnorm} \
    --nx 20 --ny 20 \
    --figure example/second_example_2d_cellgroup1_${nnorm}gauss_nx20.png \
    --title "second example 2d cell group 1 ${nnorm} gauss 20 bins"
We see that the correlation found is 0.44 +/- 0.11.
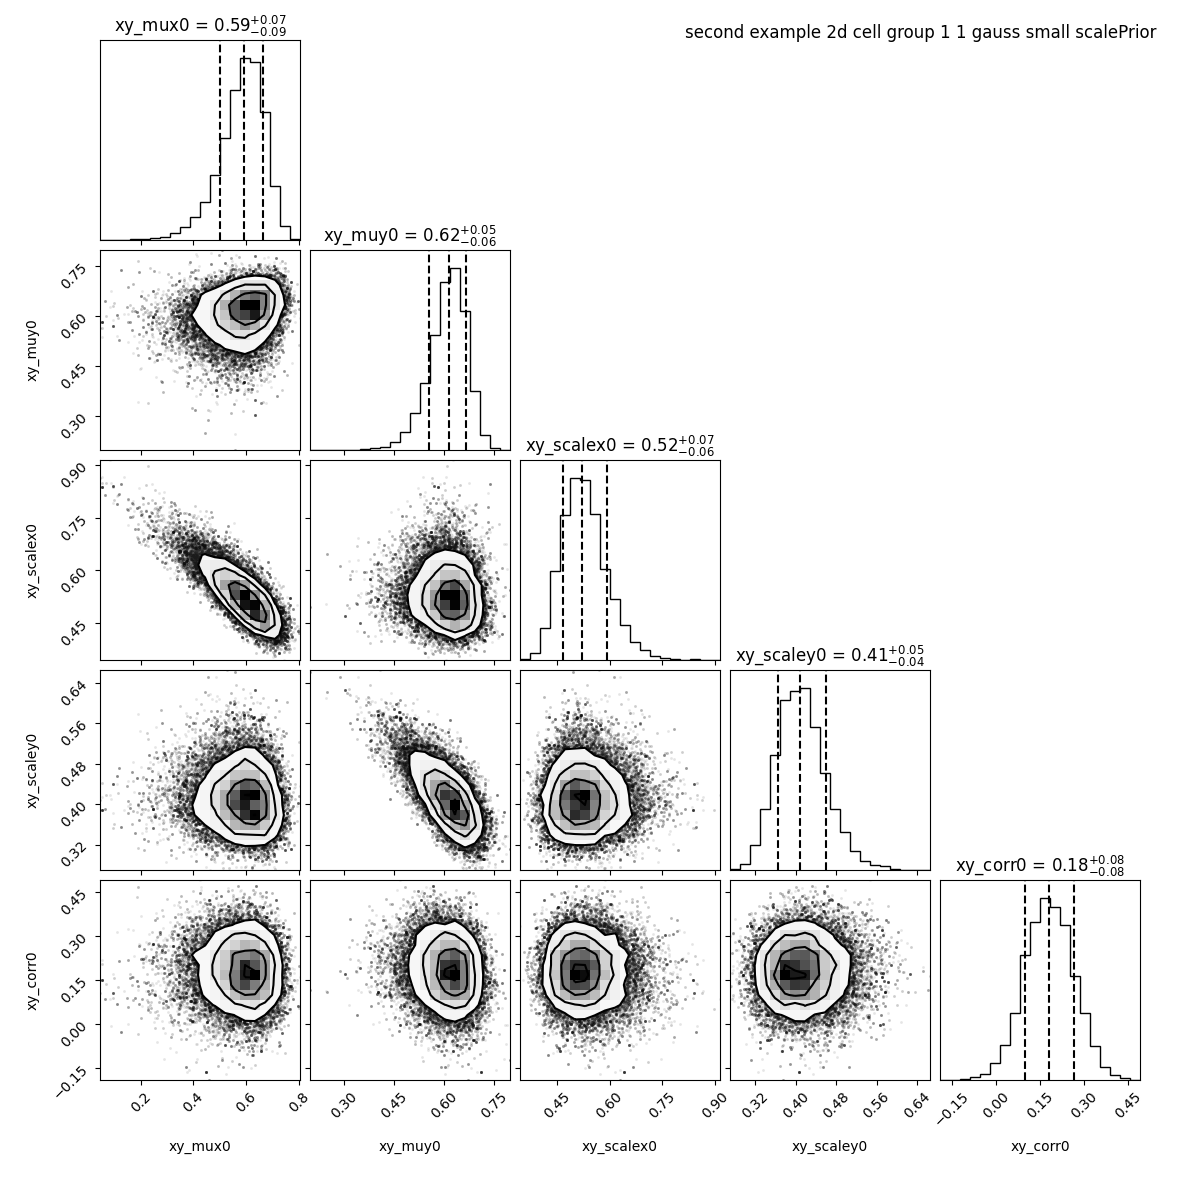
Let see how this changes if we reduce the scale of the Normal distribution of the prior to 0.1
$ nnorm=1
$ baredSC_2d \
    --input example/nih3t3_generated_second.txt \
    --geneXColName 1_0.5_0.5_0.5_0.5_0.5_x \
    --geneYColName 1_0.5_0.5_0.5_0.5_0.5_y \
    --metadata1ColName group \
    --metadata1Values group1 \
    --output example/second_example_2d_cellgroup1_${nnorm}gauss_nx20_smallSP \
    --nnorm ${nnorm} \
    --nx 20 --ny 20 \
    --scalePrior 0.1 \
    --figure example/second_example_2d_cellgroup1_${nnorm}gauss_nx20_smallSP.png \
    --title "second example 2d cell group 1 ${nnorm} gauss small scalePrior"
We see that the correlation drop to 0.18 +/- 0.08.
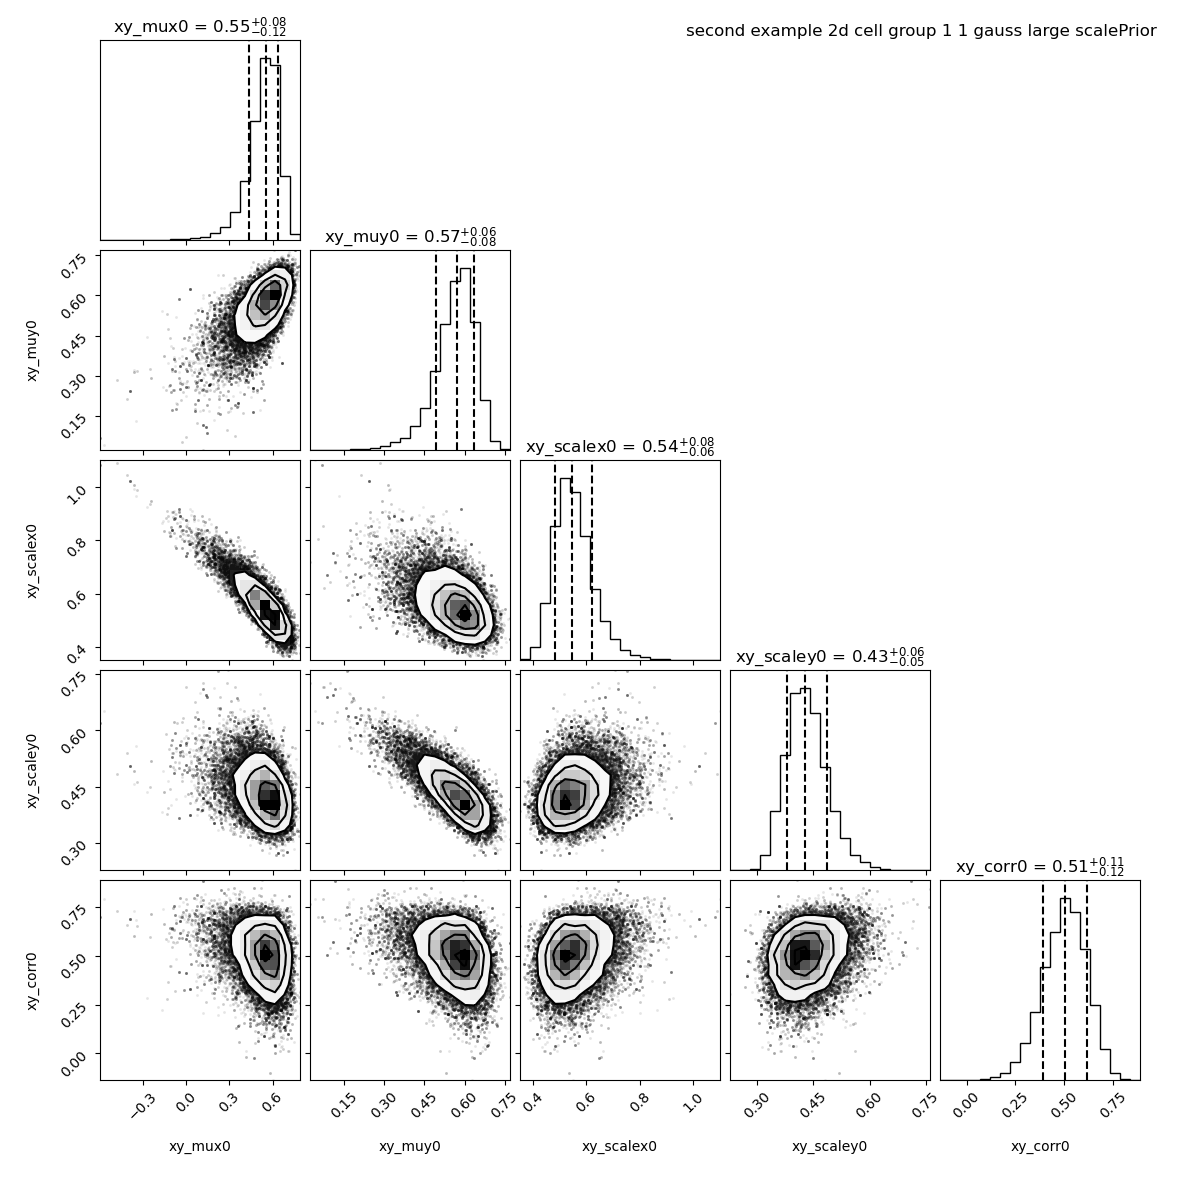
On the contrary, if we know that there is a correlation we can increase this value in order to remove the penalty on high correlation coefficient.
$ nnorm=1
$ baredSC_2d \
    --input example/nih3t3_generated_second.txt \
    --geneXColName 1_0.5_0.5_0.5_0.5_0.5_x \
    --geneYColName 1_0.5_0.5_0.5_0.5_0.5_y \
    --metadata1ColName group \
    --metadata1Values group1 \
    --output example/second_example_2d_cellgroup1_${nnorm}gauss_nx20_largeSP \
    --nnorm ${nnorm} \
    --nx 20 --ny 20 \
    --scalePrior 3 \
    --figure example/second_example_2d_cellgroup1_${nnorm}gauss_nx20_largeSP.png \
    --title "second example 2d cell group 1 ${nnorm} gauss large scalePrior"
We see that the correlation is now at 0.51 +/- 0.11.
However, these settings may detect (anti-)correlations in situation where there is no, that’s why we recommand the default value if you don’t have any knowledge on the correlation you expect.